This guide explains how to access Turnitin analytics and use it to gauge student participation and success.
To access the available Turnitin Analytics content:
From the Blackboard Ultra module select Gradebook.
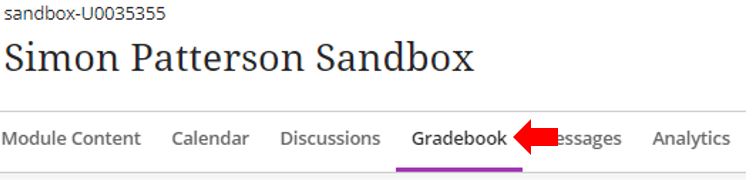
Navigate to and open the required Turnitin submission assessment.
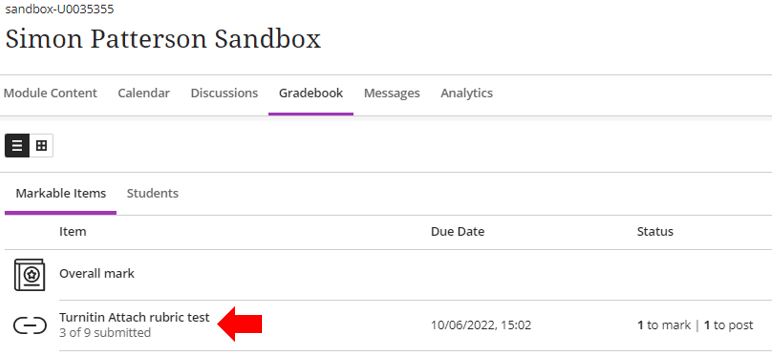
Click on the Analytics tab.
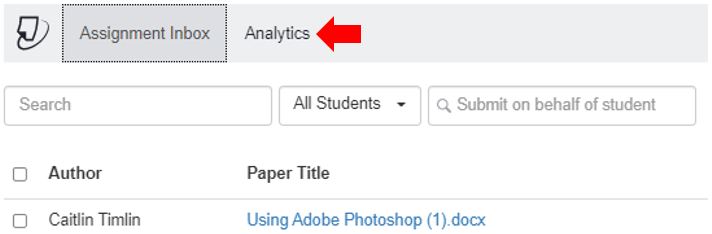
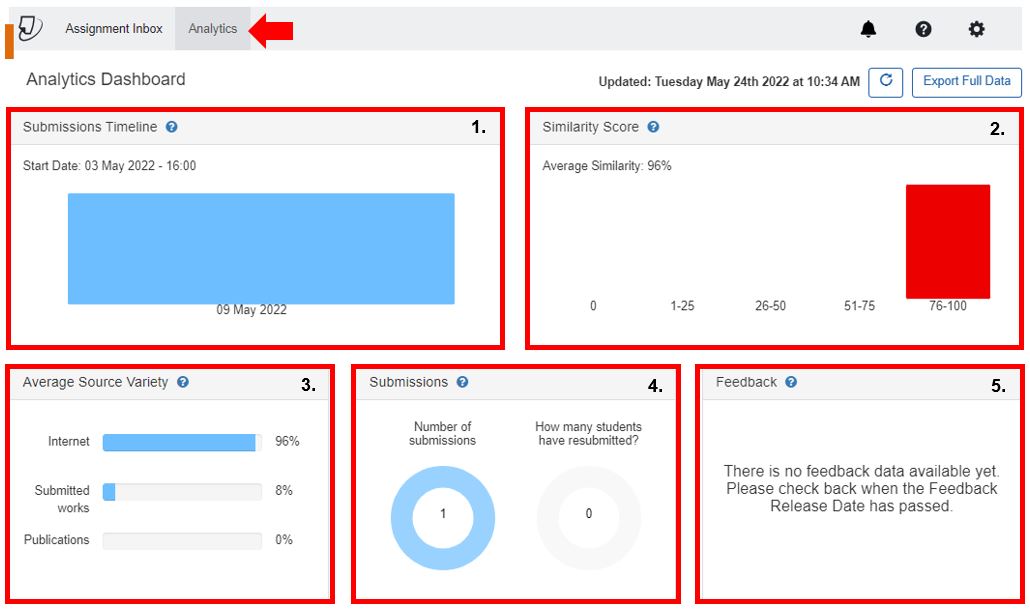
Turnitin Analytics Dashboard.
From the Analytics Dashboard, you can access:
- Submissions Timeline: The number of submissions chartered against the date of submission with the late submissions (if enabled in the assignments settings) marked red.
- Similarity Score: Similarity score ranges with the breakdown by % ranges (2)
- Average Source Variety: Average percentage of papers that contained a particular type of source.
- Submissions: Number of submissions and resubmissions.
- Feedback: Number of students who viewed/not viewed their feedback and the average time before feedback is viewed.
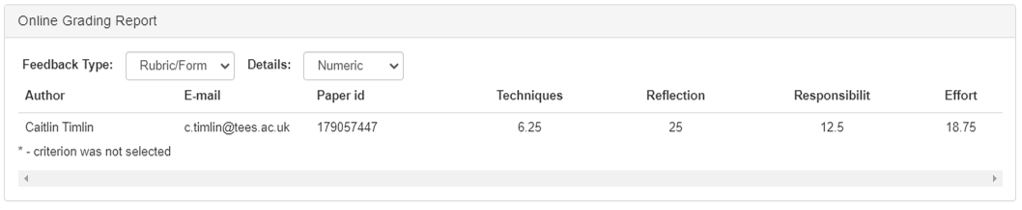
Turnitin Grading Report.
The Turnitin grading report will give you an overview of quick mark sets that have been used and how many comments out of each set have been allocated to different students.
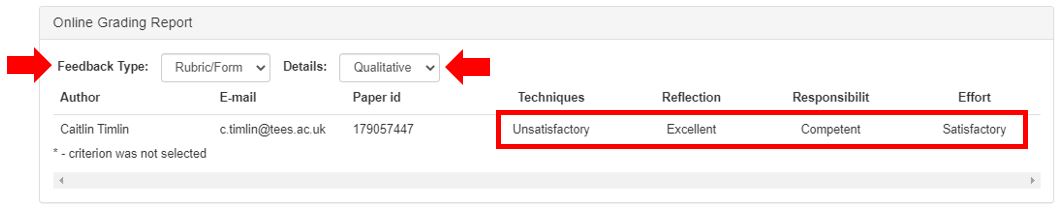
Online Grading Report is displayed below the Analytics Dashboard.
In addition to the default overview, the online grading report gives, clicking on the Details dropdown menu allows the selection of a particular comment bank or QuickMarks set such as “Commonly Used”. The commonly used mark set will give an overview of the different comments that have been used the most and which students had which comments allocated.
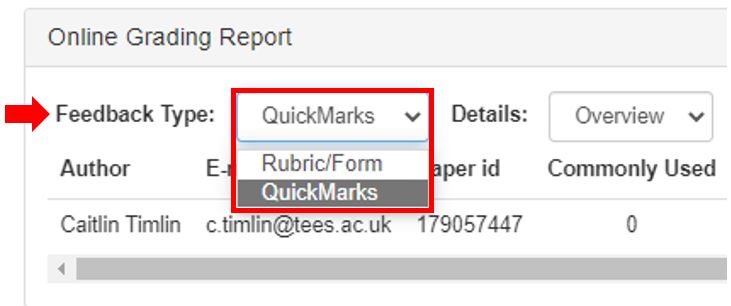
The Feedback Types can be switched to review the Rubric/Form results and review the associated criteria included within the rubric. Using this feedback would allow you to identify if there is a particular criterion that all students are failing on as well as which criteria they are doing well with.
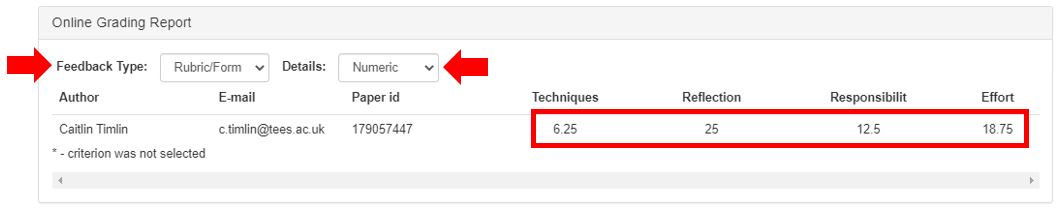
The feedback can be viewed as either Quantitative or Qualitative. Using the qualitative would show the performance descriptors for each criterion that the students achieved.