
This guide has been created to inform lecturers on how to use the question analysis tool included with Blackboard Ultra to see questions that your students, as a cohort, answered correctly or struggled with. You can use this to tailor future lessons or adjust quiz questions for future cohorts.
Question Analysis
Question analysis can provide statistics on overall performance, assessment quality, and individual questions. This information will support the identification of questions that might limit a student’s ability to score highly.
Question analysis can be accessed from one of the following locations:
1. A test deployed in a Module Content.
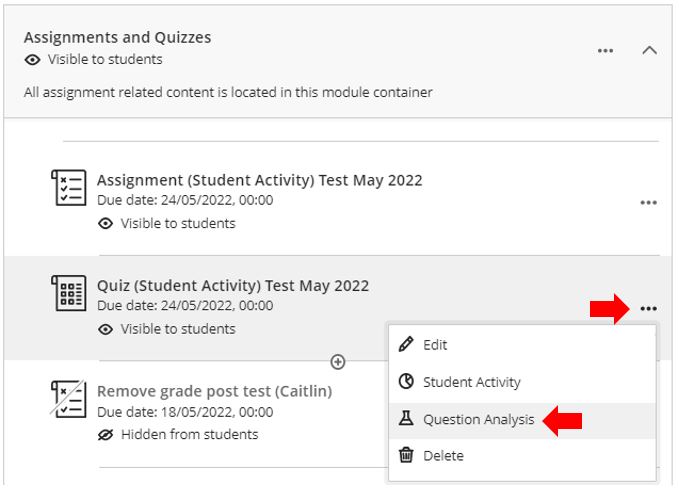
In the Blackboard Ultra module in question, open Module Content, locate the assessment to analyse, click on the 3 dots and select Question Analysis.
2. A deployed test listed on the Gradebook.
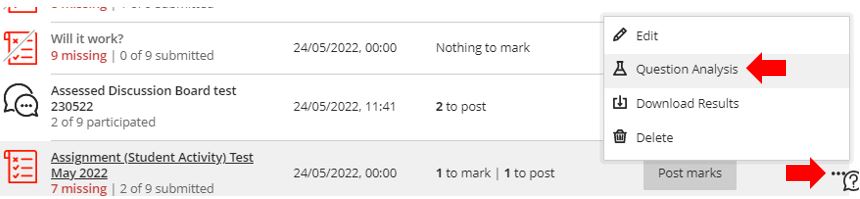
In the Blackboard Ultra module in question, open Gradebook from the top menu, locate the assessment to analyse, click on the 3 dots and select Question Analysis.
3. Running a report in Analytics.
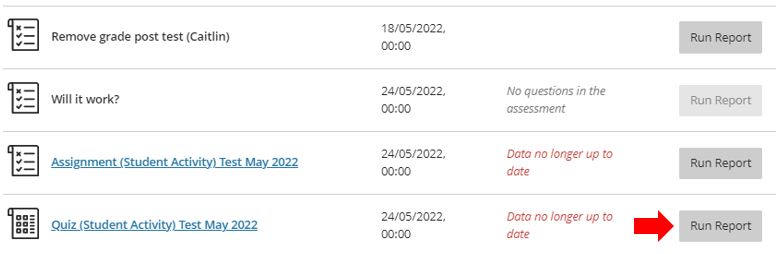
In the Blackboard Ultra module in question, open Analytics from the top menu, locate the assessment to analyse and click the Run Report button.
Question Analysis / Analytics results output
Depending on the size of the assessment and the number of students that have already completed it the report can take from a few minutes to over an hour to compile.
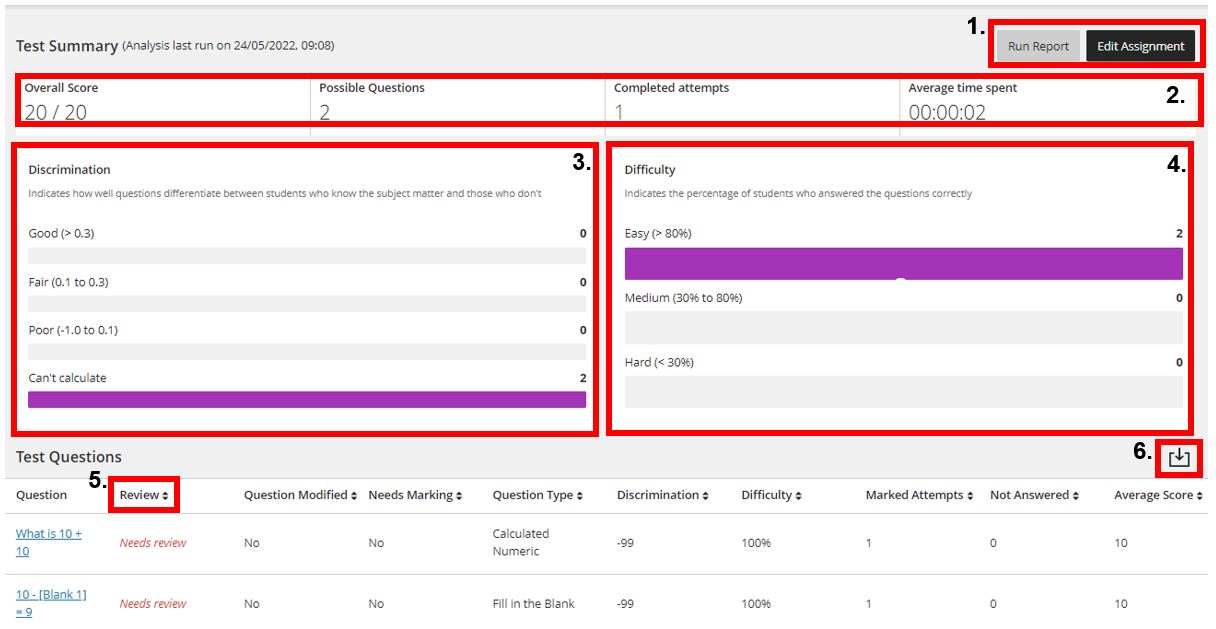
- Rerun Report or Edit Assessment to make a change to questions.
- Test Summary of statistics for the individual assessment.
- Discrimination: Indicates how well questions differentiate between students who know the subject matter and those who don’t.
- Difficulty: Percentage of students who answered the questions correctly.
- Select a heading to sort and filter the questions. For example, sort the Review column so questions that need review appear first.
- Download the question analysis report.