This guide has been created to inform users of the available analytics tools that exist in Blackboard Ultra Discussion Boards. Through the analytics available, staff can get an understanding of student engagement at a glance, especially useful with large cohorts of students.
Discussion analytics are accessed from the Discussions or Course Content pages. For all discussion boards, there will be a Student Activity panel. For assessed discussion boards, there will be an additional Marks & Participation panel. The following is a summary of what can be found in both sections, followed by a more comprehensive breakdown
Student Activity
This space allows you to view information about the discussion including:
- Active students
- Average posts per student
- Average word count
- Average discussion mark (if appropriate)
- A percentage of student participation
- Students who haven’t participated
- Responses with the most replies
- Top participants
Marks & Participation
If your discussion board is marked, you can access an additional Marks and Participation panel. From here, click on a specific student to reveal:
- An overview of their posts
- An Analysis of their discussion, breaking down their contributions into:
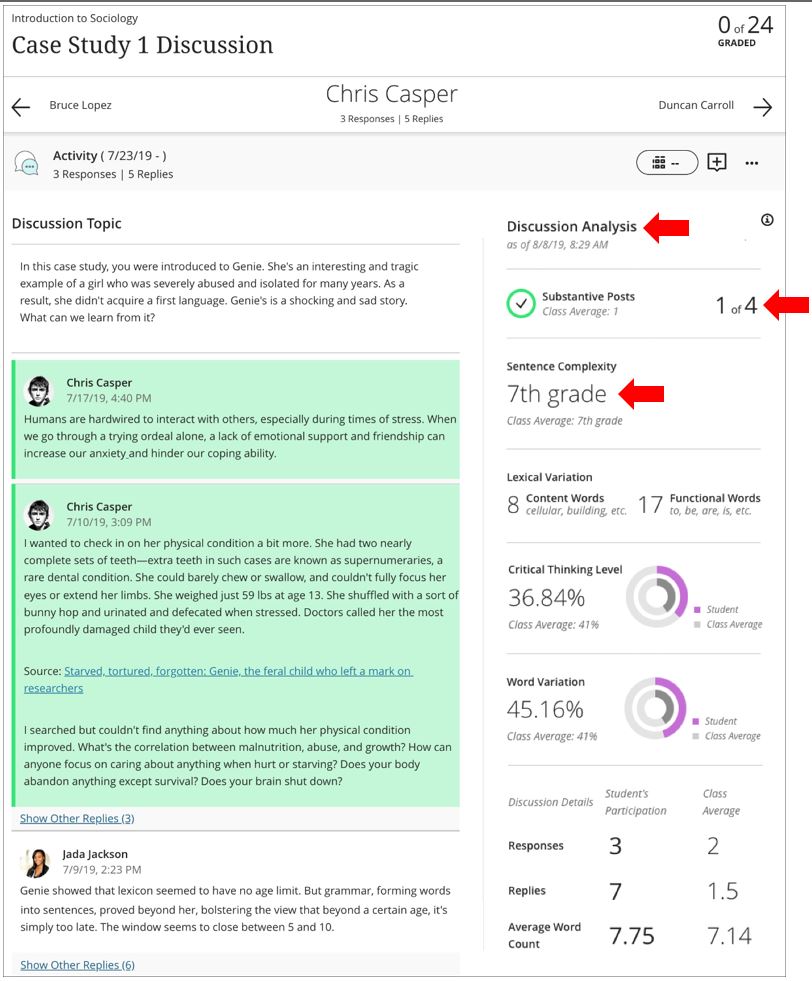
- How many substantive posts were made – the number of responses and replies that contribute to the discussion’s development.
- Sentence Complexity – average grade level readability for the student’s posts.
- Lexical Variation – count of content words and functional words. Content words support the student’s ideas, while functional words support proper grammar.
- Critical Thinking Level – percentage of words and phrases within a student’s total posts that demonstrate critical thinking.
- Word Variation – percentage of unique words in a student’s responses and replies.
- A breakdown of how many responses, replies and average word count
Student Activity
From within the Blackboard Ultra module, locate the discussion board. You can do this from the Discussions space, or from with the Module Content area depending on your preference.
Either open up the discussion board directly and select Student Activity, or click the ellipses (three dots) to the right of the discussion board name and from the menu select Student Activity.
The Student Activity page for the discussion board will now open, allowing you to review individual discussion posts and student participation. The following screenshot is divided into four main sections, each described below.
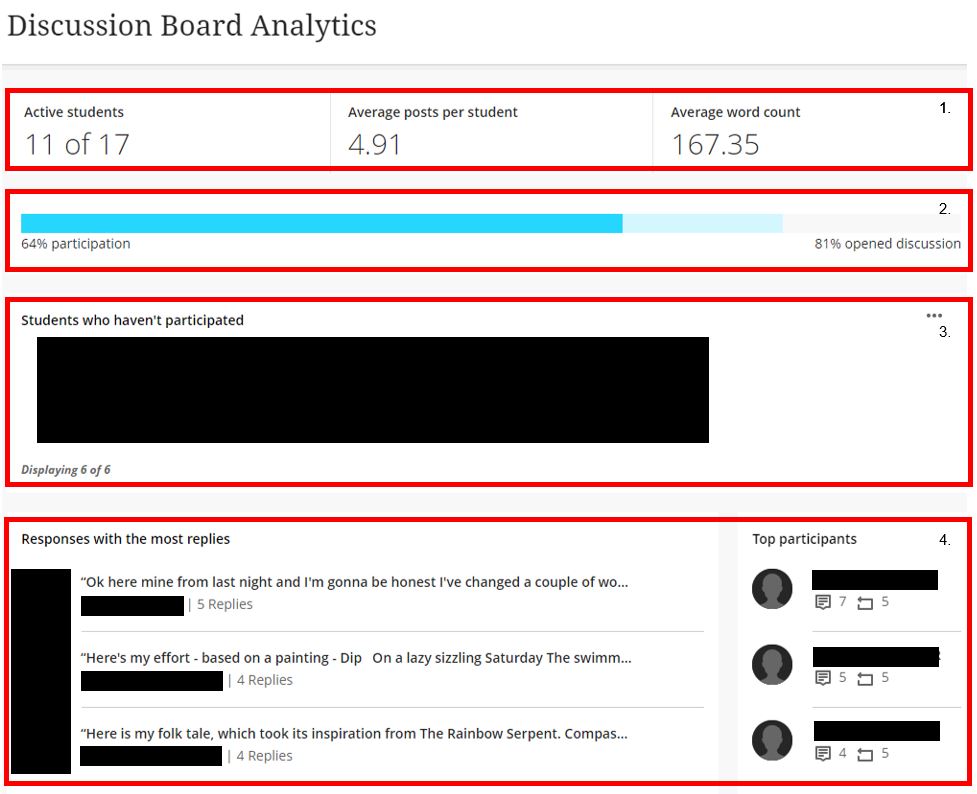 Section One – The analytics starts with a breakdown of the engagement with the discussion board artefact including:
1) Number of active students
2) Average posts per student
3) Average word count per post
Section Two – The participation provides a percentage of student participation. The bar highlights in blue the percentage of students who’ve opened the discussion and participated.
Section Three – The analytics report also identifies students who have not participated with the discussion board. From this panel, you can send a Message to all those non-participating students (who will receive the message on an individual basis), or click on an individual students profile to write them an individual message. Please note that this is NOT an email but a message via Blackboard’s messaging system.
Section Four – This area provides you with a summary of responses that have the most replies. Select one of the comments listed in the Comments with the most replies section to be taken to that discussion thread. You can also select a student from the Top Participants section to open that student’s discussion contributions.
Marks and Participation
When a discussion board is set to be marked, this opens up further analytics for individual students, allowing you to get a deeper understanding of their participation.
Discussion analysis averages are calculated by comparing a student’s responses and replies to those of other students participating in the same discussion.
From the Marks & Participation page, select a student to view a detailed analysis. The following is an example of a student’s analysis:
Discussion analysis in more depth
- Substantive posts: Substantive posts are the number of responses or replies that contribute to the discussion’s development. A substantive post contains sentences that establish or support a student’s position or ask thoughtful questions. These posts also show critical thinking or sophisticated composition, based on word choice and variety. Non-substantive posts may be short or underdeveloped. For example, a simple “Yes” or “No” reply to a discussion prompt isn’t substantial. Students need to expand on their answers and explain their positions to make the responses or replies substantial.
- Sentence complexity: Sentence complexity is measured by the number of sentences, the complexity words, and how often the words are used in each response.
Lexical variation
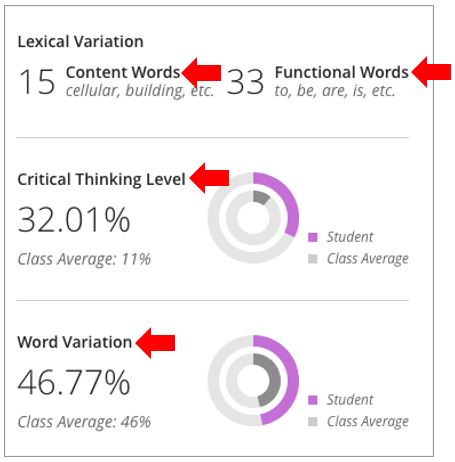
Lexical variation analyses the substance of a student’s responses or replies based on the words they’ve used.
- Content words carry meaning in a student’s response or reply. These words show a student’s feelings or thoughts regarding the prompt. When compared with total word count, content words help show the lexical density of a student’s responses and replies. A high count can indicate more sophisticated writing.
- Functional words unite the semantic elements of a sentence together and indicate proper grammar. Prepositions, conjunctions, pronouns, and articles are functional words.
Critical thinking
Critical thinking indicates words and phrases within a student’s total posts that demonstrate critical thinking. Words used will fall into one of the following categories of critical thinking:
- Argue a position
- Include supporting data
- Cite literature or experience
- Evaluate
- Summarize
- Reference data
- Offer a hypothesis
How Blackboard Ultra measures critical thinking
The weighted number of the words and phrases in each category are combined and then compared to the class average to create the critical thinking score. The score is the difference between the student’s critical thinking and the class average.
The score falls in a decimal range of -1 to 1. A negative score means the student’s critical thinking is below the class average. A positive score means the students critical thinking is above the class average. A score close to 0 means the student’s critical thinking is at the class average level. These scores are represented by a range of low to high:
- -1 < -0.06 = Low
- -0.06 to -0.03 = Below Average
- -0.03 to 0.03 = Average
- 03 to 0.06 = Above Average
- .06 to 1 = High
Critical thinking is represented visually to show each student’s score compared to the class average.
Examples:
- Empirical research shows disagreeing displays a higher level of critical thinking than agreeing. In a discussion, the statement “I agree with John” receives a score of 0.113, while “I disagree with John” receives a score of 0.260.
- If students summarize a passage but add no opinion or argument, they score lower than others who argue a position.
- If students cite literature, they receive a lower score than others who offer a hypothesis.
Word variation
Word variation measures the number of unique words in a student’s submission as a percentage. A higher percentage of unique words can show that the student’s work contains a variety of ideas and significantly supports a position. You can also compare the student’s percentage to the class average.
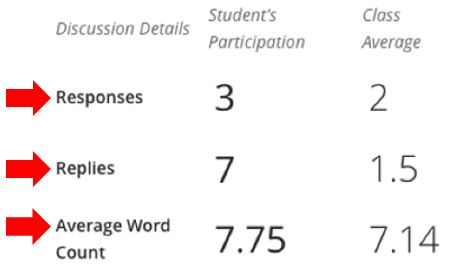
Discussion details
In addition to the calculated readability, the details include average word count, responses, and replies for each student compared to the class average. This information, along with any rubrics or criteria you set, can help you determine a grade.
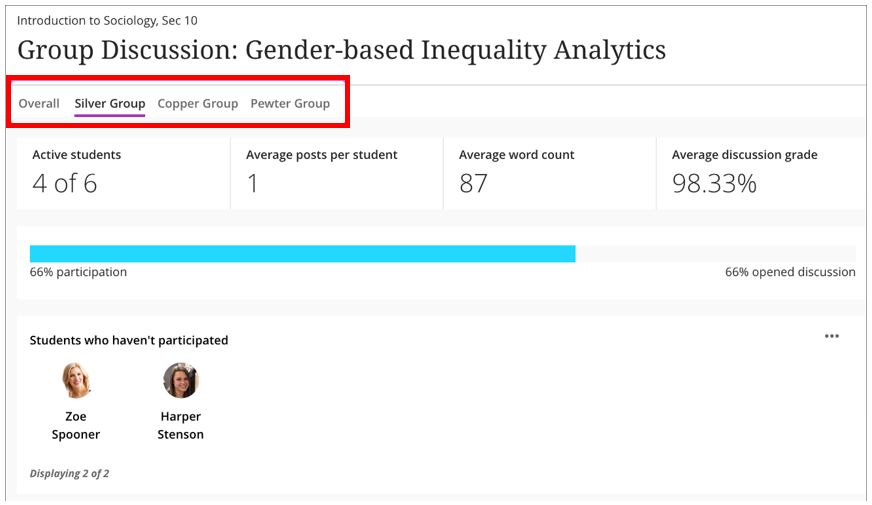
View group discussion statistics
You can also view discussion statistics for groups. Open a group discussion menu and select View Analytics. The Overall tab near the top of the page displays discussion statistics for the entire class. You can also open tabs with details for each group.